


![]()
![]()
![]()
![]()


| SuMMIT Surface Analysis Toolbox |
|---|
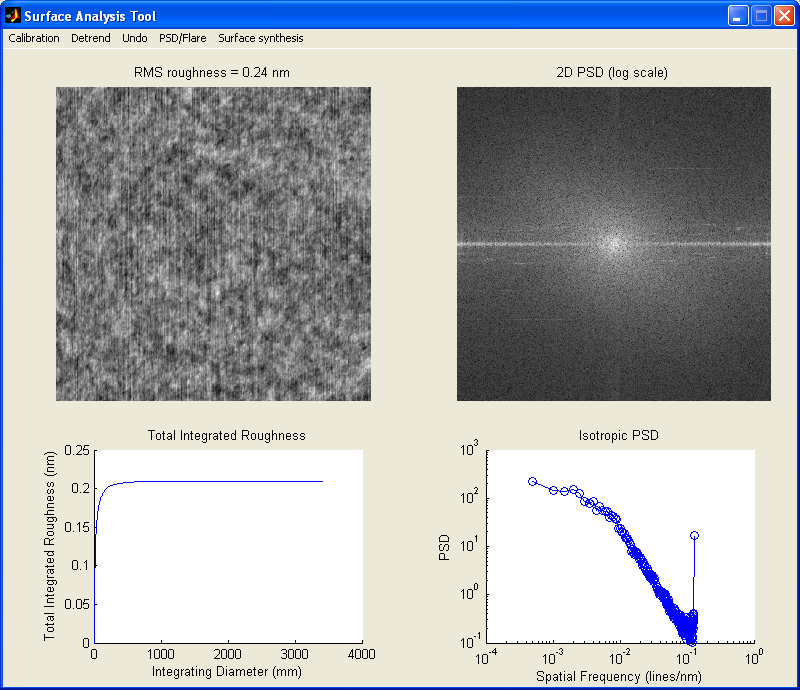
Surface Analysis
Toolbox: The SuMMIT surface analysis toolbox enables PSD
measurements to be performed given height map data. The height map data
can be input in a variety of forms including AFM and Zygo
interferometer files (these formats are available through the File->Import
menu item). Standard tiff images can also be used but the height
calibration must be set using the Calibration menu
from the surface analysis toolbox window.
The toolbox includes image detrending capabilities. Both linear and quadratic detredning options are available. Detrending allows you to much better visualize the actual roughness in the image which in its original form could be dominated by surface tilt (wedge) or curvature.
The PSD is computed using the PSD/Flare->Compute PSD menu item. The full 2D PSD is displayed in log scale in the upper right side frame. In the lower right side frame, the Isotropic (radially averaged) PSD is shown.
From the PSD, flare can be estimated given a series of parameters which can be defined using the PSD/Flare->Flare Computation Settings menu item. The user can set the wavelength, the image distance (the distance between the rough surface and the image plane). To support flare as a function of feature width computations (PSD/Flare-> Compute Flare vs Feature Size), the user can set the default field diameter and the minimum and maximum feature widths for flare computation. To support flare as a function of field size computations (PSD/Flare-> Compute Flare vs Field Size), the user can set the default feature size and the minimum and maximum field sizes.
As with most SuMMIT plots,
the surface analysis toolbox plots can all be exported by right
clicking on the plots and selecting the desired output format.
Isotropic PSD data can furthermore be imported using the PSD/Flare->
Import PSD menu item. When this is done an equivalent 2D
isotropic PSD is also computed and displayed in the PSD image region.
This imported PSD can then be used as the basis for flare computations
as described above.

Home | Products | Contact | Support
Graphics by Art for the web